Part
01
of one
Part
01
Changes in US Consumer Digital Adoption
Key Takeaways
- Only a handful of businesses (11%) claim that their business models will likely remain viable in 2023, while an estimated 64% claim that their companies will need to develop new digital business models to help them get there.
- About 52% of retailers are leveraging data to digitally engage consumers in-store to drive sales, 51% to drive rewards programs, and 47% to improve the customer experience.
- Some financial services companies are experimenting with the Metaverse, including Fidelity Investments, JP Morgan Chase, and American Express.
- The sleep technology market is expanding rapidly and has attracted new entrants, from start-ups to big tech companies. These developments have attracted insurance, healthcare players, employers, and policymakers.
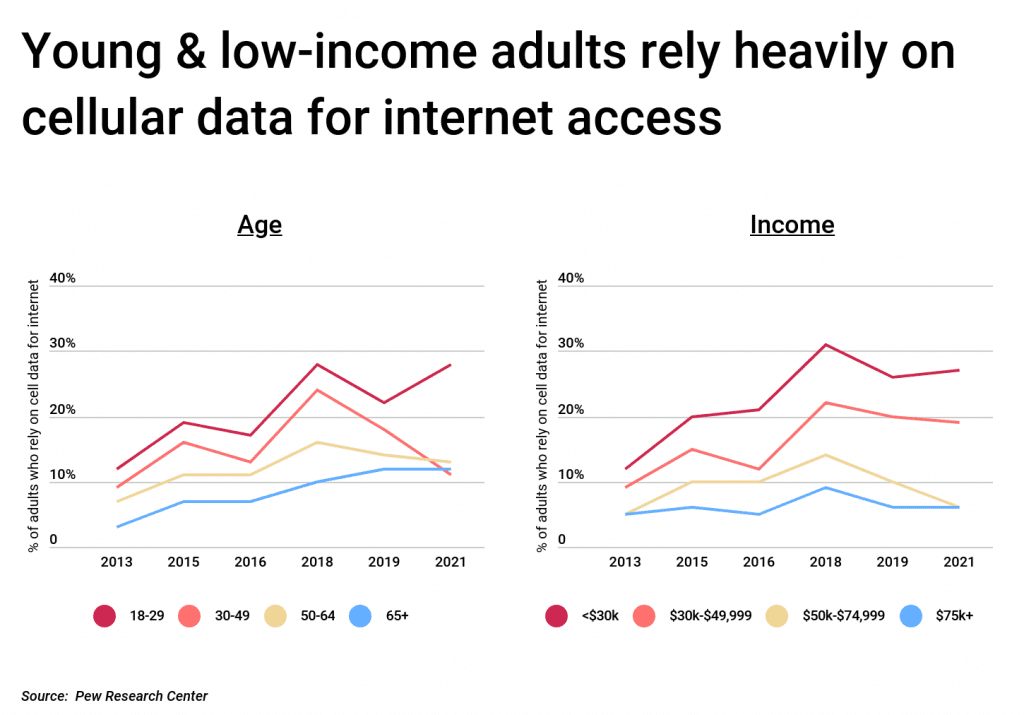
- Smartphone dependence in the U.S. for online access is high among younger generations, individuals with a high school education or less, and lower-income Americans.
Introduction
This research provides detailed analyses covering various aspects of U.S. consumer digital adoption. First, it tests the hypothesis of whether businesses have reached their peak in digital growth and whether converting consumers to digital solutions is still a strategic driver for companies at large. The research further provides trends in the next 1-2 years that will have a transformative impact on consumers and businesses and an analysis of how companies in various industries are moving strategically (where they are focusing their efforts). Lastly, the research compares various statistics surrounding the smartphone adoption rates in the U.S. since the onset of the pandemic compared to 2022. However, the most recent and comprehensive report on the U.S. smartphone adoption rates is from 2021 by Pew Research, and most of the data points shared have not changed from a previous report published in 2019.
1. Hypothesis Testing: Has Adoption of Digital Services Reached its Peak?
Have Businesses Reached their Peak Regarding Digital Growth
- The pandemic accelerated the adoption of digital technologies across businesses and industries by an estimated three to seven years within a few months.
- More recent findings show that the overall adoption rate has increased beyond what was considered "best-in-class speed for most business practices in 2018." Moreover, companies with the most digital endowment are moving even faster.
- Only a handful of businesses (11%) claim that their business models will likely remain viable in 2023, while an estimated 64% claim that their companies will need to develop new digital business models to help them get there.

- Looking ahead, 67% of the top-performing companies are positioning themselves to leverage technology as a core differentiator, 15% plan to become tech leaders, 8% plan to maintain their current status, and another 8% plan to keep up with industry standards.
- A report by Statista shows that the projected share of technology adoption by companies in the U.S. by 2022 is highest at 89% in the user and entity big data analytics category, 80% in the internet of things segment, 76% across app and web-enabled markets, 75% in machine learning, and 71% in cloud computing. More categories and their adoption rates are included in the attached Google Document.
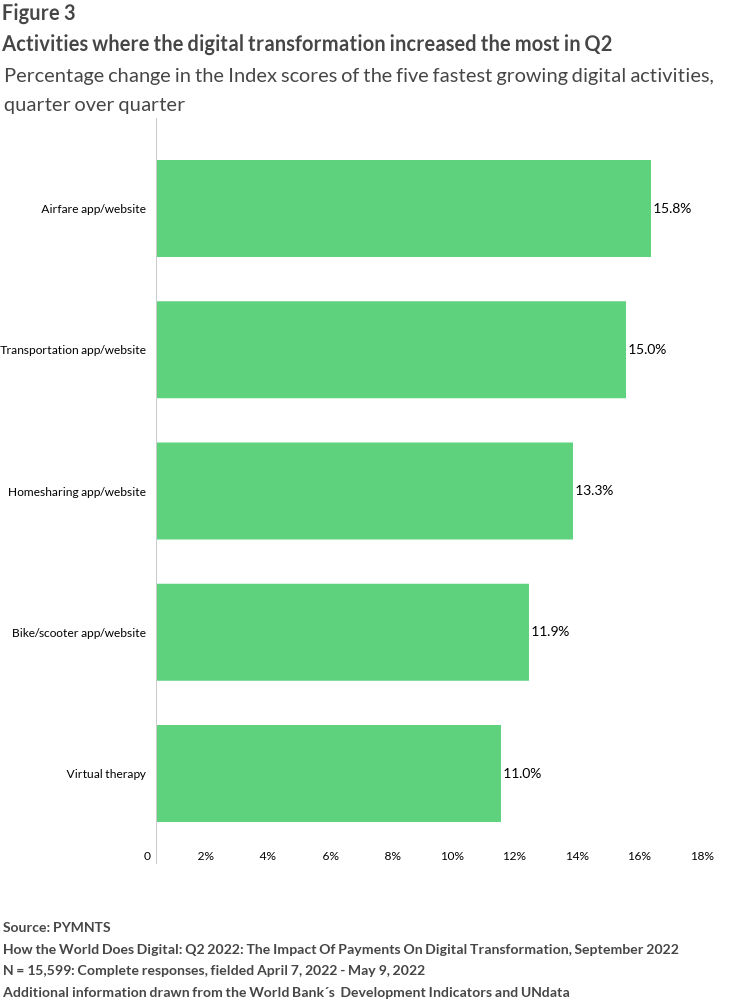
- The image below shows segments where digital transformation activities have increased.
- In the U.S., digital spending across businesses, products, and solutions increased by 9% in 2021 and could register a 7.2% year-over-year growth by the end of 2022. Additionally, over 67% of U.S. IT experts anticipated rising tech budgets during the 2021/22 period, with 26% predicting a jump of around 5% in tech spending.
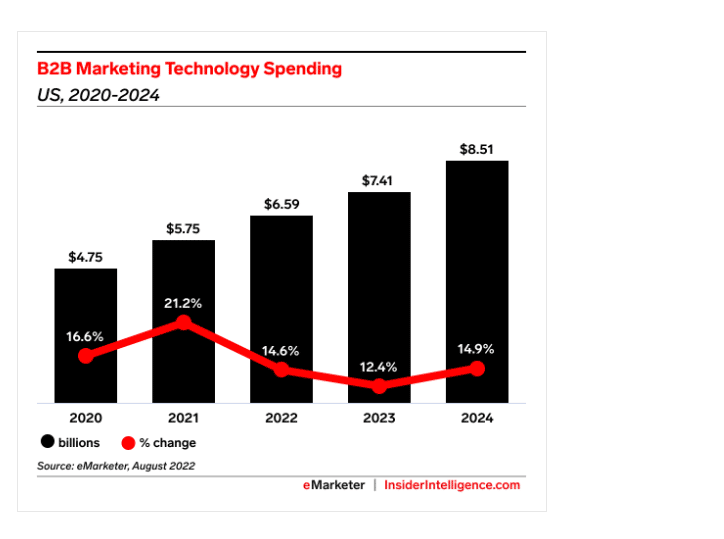
- U.S. spending on marketing technology is anticipated to continue climbing and could surpass $20 billion in 2022. Martech spending by B2B firms will increase by 14.6% in 2022, 12.4% in 2023, and 14.9% in 2024.
- Data by Corinium Intelligence shows that about 53% of businesses globally acknowledge they have digitized their client-facing business processes, another 48% have migrated data and applications to the cloud, and 42% claim to have finished digitizing their back-office operations.
- A study by Harvard Business Review shows that consumers who engage across multiple channels spent about 4% more in-store and 10% online. Moreover, businesses with robust omnichannel customer engagement strategies retain 89% of their customers versus 33% of companies with poor strategies.
- Based on the data uncovered around business digital growth, the increasing levels of activities around the various parts of business transformation, including increasing budgets, there is clear evidence that businesses have not reached their peak in terms of digital growth.
Is Converting Consumers to Digital Solutions Still a Strategic Driver for Businesses at Large?
- A report by McKinsey shows that digitally enabled innovation helps companies to bring new products to market 50% faster, lowers costs by a third, and has a double return on the investment. Companies like GlaxoSmithKline leverage artificial intelligence (AI) platforms to create demand forecasts for allergy and flu season. It also uses eye-tracking technology to understand how buyers examine products and sensory solutions to enhance the customer journey.
- McKinsey research shows that companies that successfully deploy product and digital innovations are five times more likely to generate new concepts, unlike before. Additionally, such companies leverage their broad consumer insights base to help launch new products to market faster than before the innovation.
- Innovation has forced consumers to demand simplicity and self-serve buying experiences akin to those seen on e-commerce platforms, from groceries to clothing to used-car sales. Research findings estimate that over 30% of B2B customers use digital and self-serve channels for each phase of the buying journey.
- Thus, industry leaders are developing simple and scalable digital self-service buying experiences and products they can deploy, procure, and try quickly. Atlassian is an example of a company with such a product-led growth model that has resulted in double-digit annual revenues at about 15% cost of sales for over three decades.
- In the banking sector, one McKinsey report revealed that over 60% of consumers in North America claim that they would increase their use of digital banking if fintech and financial institutions provided new digital features. At the same time, another 60% would consider digital solutions for all of their banking needs. Below are some drivers of increased use of digital banking.

- U.S. retailers are positioning themselves to take full advantage of the changing consumer needs by partnering with tech providers to enhance their digital footprint. A survey completed by DemandScience involving over 200 IT executives found that more than half of U.S. retail IT executives planned to upgrade their digital customer experience, leverage analytics-backed decision-making, and increase overall investments in AI.
- About 52% of retailers are leveraging data to digitally engage consumers in-store to drive sales, 51% to drive rewards programs, and 47% to improve the customer experience. An estimated 45% of IT decision-makers indicate that inventory availability is a core consumer preference that drives tech purchase decisions, while 41% claim that personalized shopping experiences influence their choices, and 45% of the respondents noted that customers also prefer free, reliable Wi-Fi as a driver.
- A recent Deloitte report discusses a mid-sized bank that launched a digitally native business product providing customers with a mobile-centric banking experience based on a new digital banking architecture. The new digital offering attracted thousands of new customers and has since become part of the company’s growth strategy.
- Existing research shows that digital solutions continue to play a critical role in driving positive customer experiences, characterized by continuing adoption of digital solutions aimed at engaging and converting prospective buyers. These activities indicate that converting consumers to digital solutions is still a strategic driver for businesses at large.
2. Trends Expected to Have Transformative Impact on Both Consumers and Businesses in the Next 1-2 Years
The trends below were selected due to numerous mentions across business and market reports as being among the key trends anticipated to transform both businesses and consumers. The reports mentioning the trend include those published by Forbes, PR Web, EY, Deloitte, and McKinsey, among others.
The Metaverse
- The Metaverse, often considered the next-generation internet, is a collective, shared, virtual space where digital interaction and simulation of physical, real-world events happen, including banking, shopping, socializing, and working. The Metaverse has attracted major industries and brands that have joined to build new businesses, monetization models, and new approaches to customer experience.
- Research findings indicate that the use cases of Metaverse will likely expand beyond the enterprise technology and manufacturing sectors. Moreover, the democratization of content will enable consumers to use the Metaverse for different activities, including socializing, living, and transacting.
- These scenarios and environments would be driven by devices like AR glasses, smartphone apps, VR headsets, digital currencies, and non-fungible tokens.

- From a retail perspective, experts foresee great first movers opportunities for RCP companies in a new retail market estimated to generate $1 trillion in revenues. By 2030, the Metaverse is predicted to reach up to $5 trillion in generated revenues.
- The increasing investments into the Metaverse play a vital role in developing the future of retail. First movers can potentially establish new brand loyalties that could grow beyond the virtual space.
- According to Melanie Subin, a director at The Future Today Institute in New York City, "By 2030, a large proportion of people will be in the metaverse in some way."
Continued Inflation, Rising Prices, & Supply Chain Security
- In the U.S., inflation rates have soared to unprecedented levels pushing prices for daily purchases to luxury items up. Unfortunately, these negative trends will likely to impede the empowered consumer from embracing new retail trends and major trends like the Metaverse.
- For instance, U.S. retail and consumer products (RCP) companies may be unwilling to invest in consumer marketing and engagement technologies in the wake of rising prices aimed at countering the effects of the pandemic, slow supply chains, talent shortages, and geopolitical conflicts.
- Over time, RCP companies may fail to maintain demand for their higher-priced items, and consumers may view the increasing prices as a means for businesses to increase their profit margins.
- Supply chain issues triggered by the COVID-19 pandemic have only worsened following the war in Ukraine. Businesses are therefore encouraged to heighten their supply chain resilience.
- One way to strengthen their supply chain networks is by reducing exposure to volatile market prices and securing their supply chain networks through protective measures aimed at dealing with shortages and logistics costs. Other options include becoming self-reliant or finding alternative suppliers.
- Hitendra Chaturvedi, a supply chain management professor with ASU’s W.P. Carey School of Business, noted, "We’re seeing inflation that we haven’t seen in 40 years, and our paychecks are not keeping up with the pace...this problem could potentially stretch out into the first quarter of 2023."
3. How Companies in Select Industries are Moving Strategically (Focusing their Efforts)
Financial Services Sector
- The broader financial services sector's strategic moves depend on the segment served. For instance, in the investment management space, many portfolio managers are investing in next-generation capabilities to help them provide superior risk-adjusted returns to index investing.
- On the other end, insurers are exploring new markets, especially the unserved and underserved markets. In addition, some are partnering with insuretechs to improve top and bottom-line results.
- For example, CoverTree, an insurtech company headquartered in Michigan, recently partnered with Socotra to provide affordable and easy insurance for landlords, owners, and renters of manufactured homes.
- The financial services sector also focuses on improving the customer experience and operational efficiency. Companies in this sector are increasing technology spending to drive operational efficiency and enhance the overall customer experience.
- Some financial services companies are experimenting with the Metaverse, including Fidelity Investments, JP Morgan Chase, and American Express.
- Other focus areas for financial services companies include building deeper financial relationships, reshaping wealth management business models, designing improved service models for commercial banks, developing value creation strategies, focusing on ESG principles, and investing in cloud strategies.
Gig Economy: Food Delivery
- The gig economy, notably food delivery, has expanded in the recent past owing to the movement restrictions imposed by the pandemic. However, with the adverse effects of the pandemic easing, delivery companies are no longer experiencing the demand they saw during the pandemic. Thus, most are changing and adopting new strategies to propel them into the near-term future.
- Importantly, these gig economy players are slowing down their hiring spree. Unlike during the pandemic when delivery jobs were lucrative, they no longer attract huge crowds as the pandemic continues to cool off.
- Individual companies within the space are making distinct strategic moves. For example, DoorDash has been developing its DoorDash Drive platform, a business-to-business service providing drivers to businesses via the DoorDash website or app. The company recently ended its partnership with Walmart and entered into a new partnership deal with Meta.

- Instacart is also expanding its suite of products and services. Some include new in-store tech for merchants and intelligent shopping carts — Caper Cart, powered by AI and equipped with Amazon Go-style technology to allow shoppers to shop for grocery items without scanning. The company also launched a new "scan and pay" solution that works with mobile devices.
- Other solutions include Instacart+, Instacart's subscription model that costs $10 per month or $99 per year. In addition, the company offers in-app advertising features to allow brands to market their products in-app. Equally, the company is offering Carrot Warehouses that work as fulfillment centers for orders instead of collecting items off store shelves.
- According to McKinsey, the industry looks promising, but a few factors underscore its growth potential. First, in the coming years, geographic competition among delivery apps has emerged as one of the major battlegrounds. As platforms widen the scope of their services, the battle will extend to restaurants, drivers, etc., all competing for the same market share.
- The market will continue to witness the rise of new specialized delivery apps, such as Slice, for pizza and Hungry Panda, for Chinese food only. Another strategic focus area for the gig economy is the restaurant commission fees that remain contentious. Some local and state governments have imposed caps on those commissions, and some plan to make the caps permanent.
Healthcare (Large Healthcare Systems)
- Leading Health Systems (LHS) are shifting their strategic focus toward increasing their market share of patients and creating solutions to solve labor and supply chain costs. Most of the top health systems in the U.S. plan to implement specific digital front door capabilities and expand access to digital capabilities.
- The U.S. healthcare system is transitioning from the traditional hospital-based model to Care at Home ecosystems. By 2025, research shows that an estimated $265 billion worth of care services could move from traditional facilities to the home. Regulatory changes by the Centers for Medicare & Medicaid Services (CMS) will accelerate further the transition to Care at Home and community-based settings.
- Digital health will likely expand in the U.S., considering an estimated 80% of health systems plan to expand their investment budgets in digital health over the next five years. In addition, over half of the patients surveyed indicated an increased appetite for digital health, including telehealth visits.
- Another critical area of focus is artificial intelligence (AI) and machine learning (ML). Health systems have shown interest in AI/ML-reliant healthcare applications and rank them as a high or moderate organizational priority. However, despite these interests, 62% of clinicians have not started working with AI/ML tools.
- Regarding financial health, clinicians are more concerned with Medicare reimbursement and financial incentives from payers. Health system executives expect value-based care models to form a significant portion of their revenues in the future.

- The HCA Healthcare System is an example of a leading U.S. health system leveraging these strategic moves. For instance, it has a strategic nursing plan focusing on advocacy and leadership, increasing performance visibility, consistency in nursing practice and operations, and leveraging scale to drive performance.
- CVS also has a strategic plan aimed at lowering costs. The company expects $4.3 billion in savings for patients aligned to its template formularies and savings of $123 per member — for patients aligned to its template formularies.
AI/Machine Learning technology
- AI and ML have broader applications across industries, from manufacturing to helping mitigate climate change. As a result, its focus areas are expansive, and new user needs arise every time requiring AI intervention. AI experts at EY predict that AI focus is more concentrated in the customer service segment. In the manufacturing space, the concept of a digital twin and performing predictive maintenance on that digital twin are among the focus areas of AI and ML.
- Businesses can leverage AI to create digital twins of a product, technology, or service user in the customer service segment. Next, they can explore the users' behaviors when using the product to get ahead of them and mitigate any issues that can arise through a proactive outbound experience.
- AI and ML leverage intelligent applications to "solve classification, prediction, and control problems to automate, add, or augment real-world business use cases." The continued support for innovation has led to the rise in the adoption of AI and its use cases. The adoption of AI across organizations in the U.S. jumped to 55% in 2021 from 51% in 2020.
- In the retail setting, AI can enhance operations by integrating with store-of-the-future technologies and solutions, combined with intelligent scheduling and forecasting, to mitigate the current challenges undermining the retail experience.
- For example, in the U.S., getting a phone line activated can take up to an hour. About 40-50% of phone purchases happen in retail, and shoppers must wait for their phone lines to become active before leaving. AI can come to the aid and put that time to good use by either displaying customer-relevant ads or other informative advertising content.
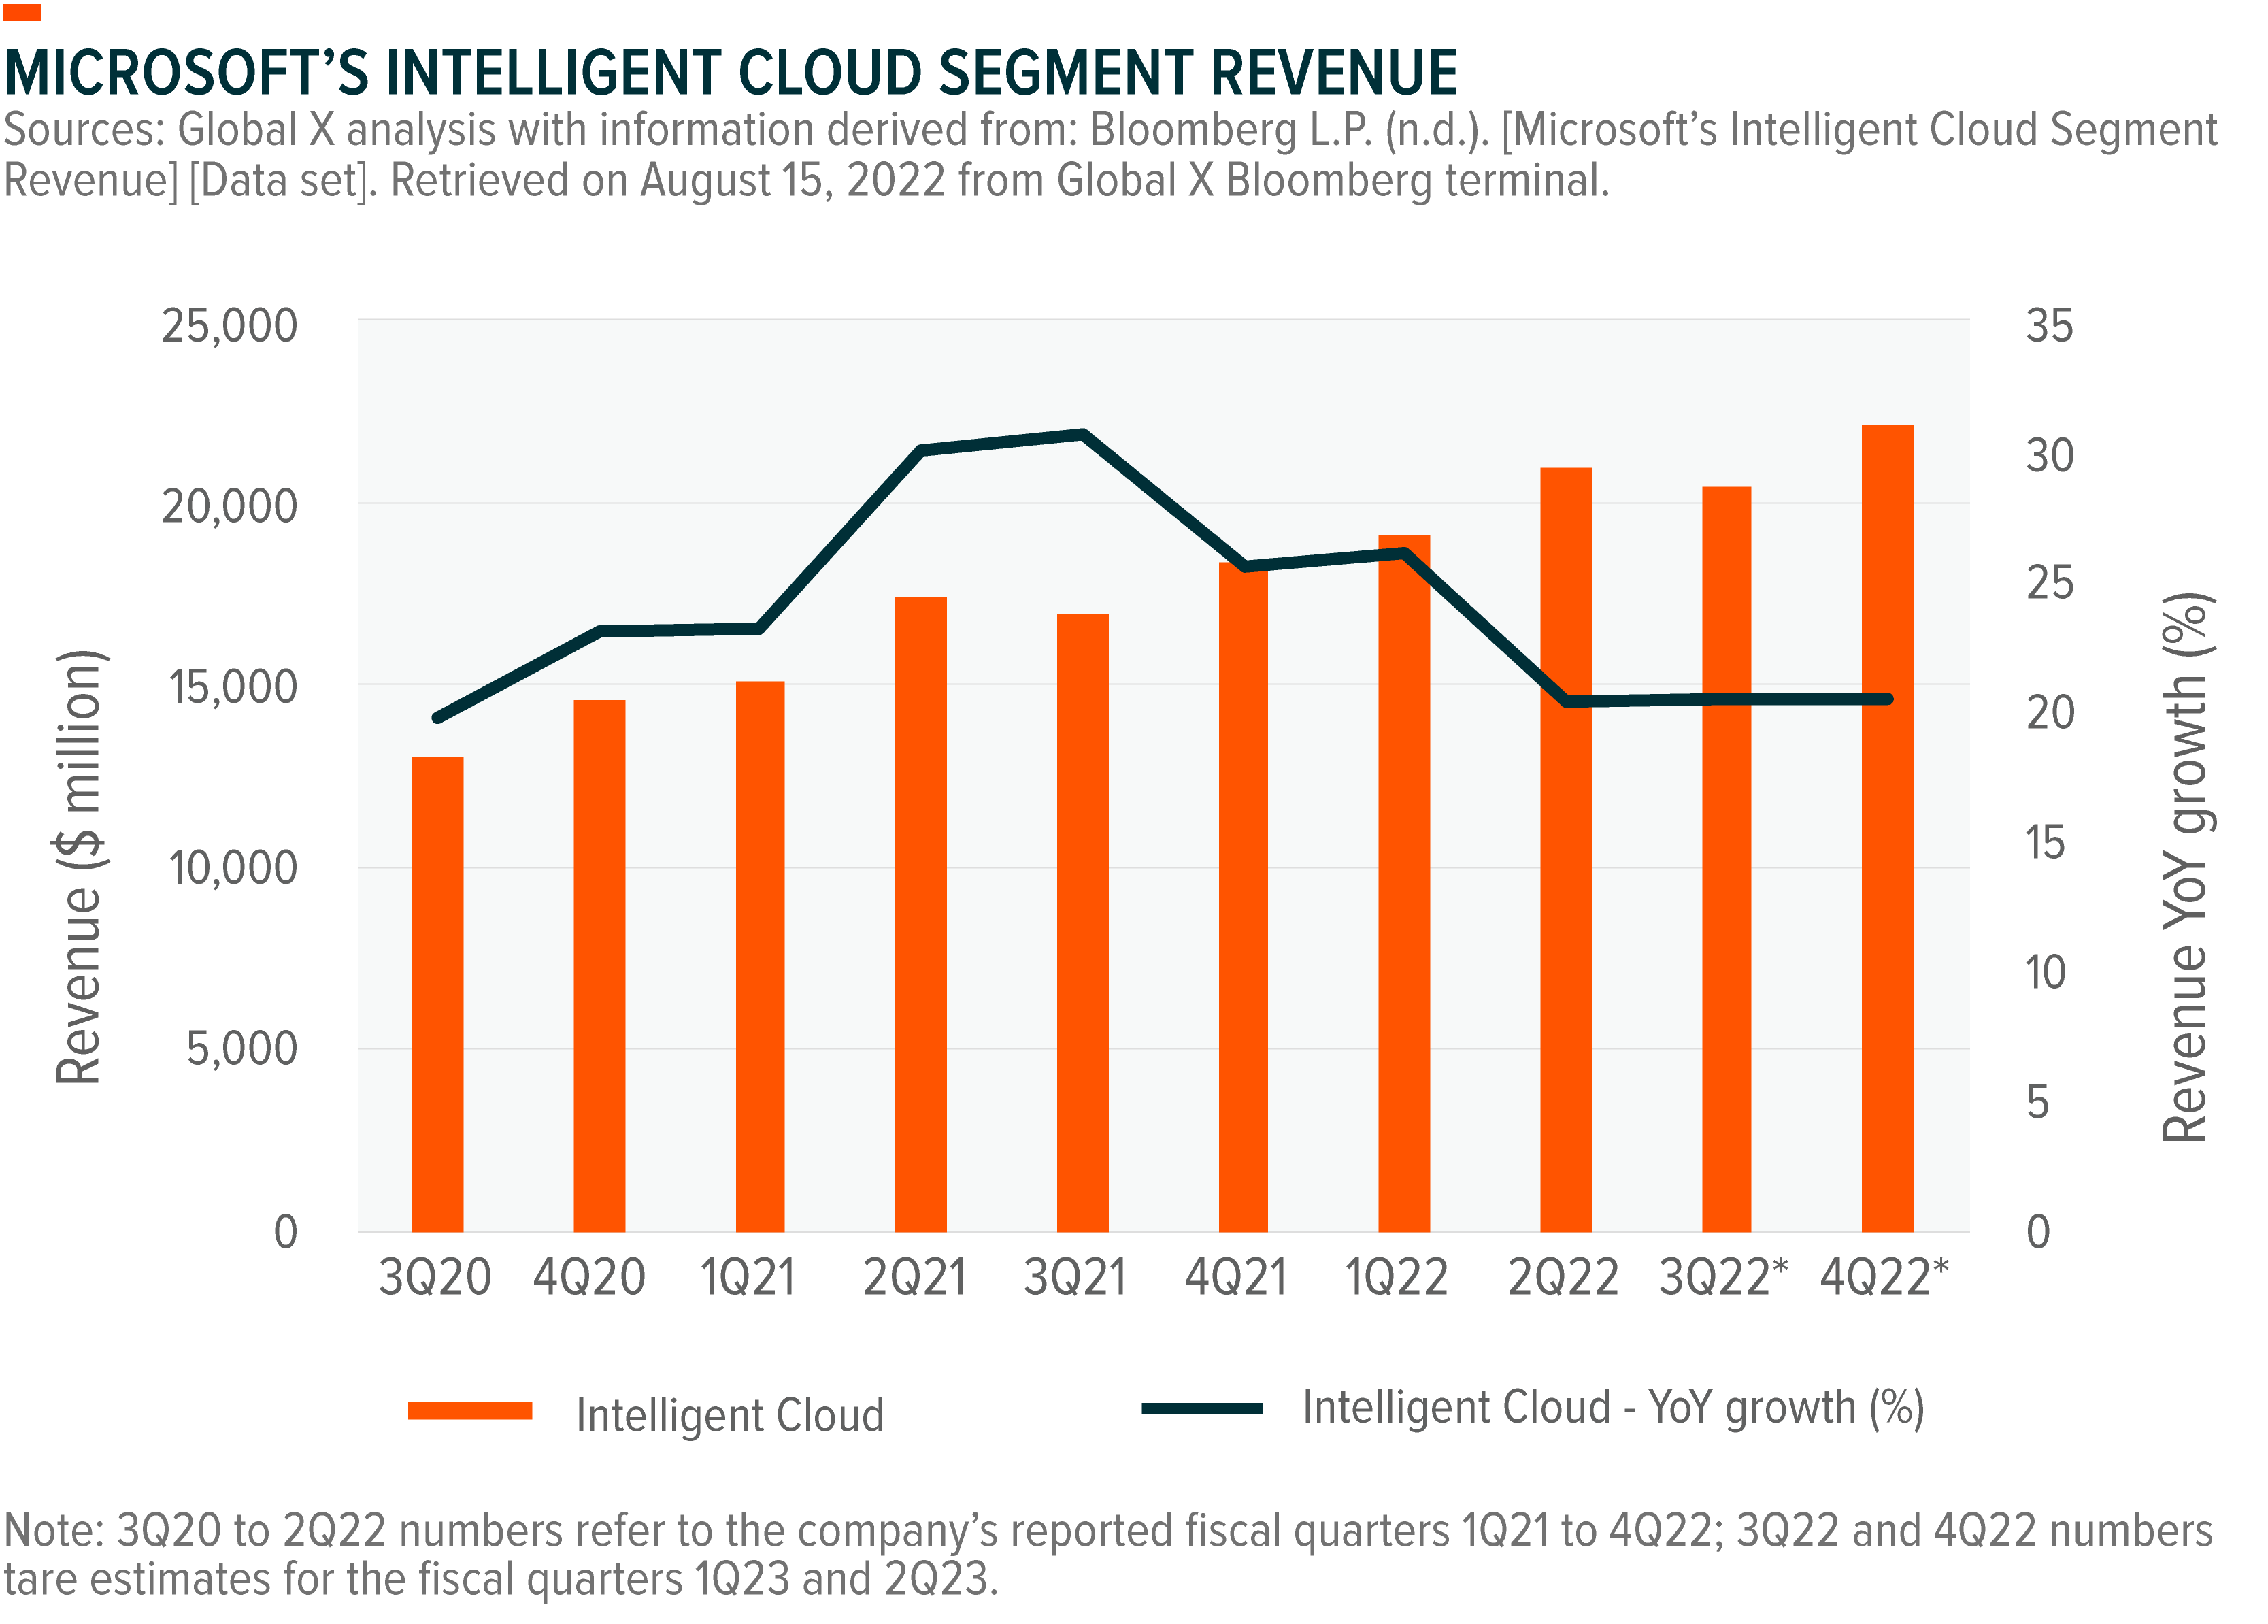
- Leading players in AI and ML, such as Microsoft and IBM, are continually enhancing and expanding their AI-driven products and offerings. For example, Microsoft has introduced new AI capabilities to its suite of tools and solutions. In addition, its AIaaS product suite offers consumers sophisticated capabilities like "high-quality vision, speech, language, and decision-making AI models." The company's AI offering seems to be performing well as evidenced by increasing revenues.
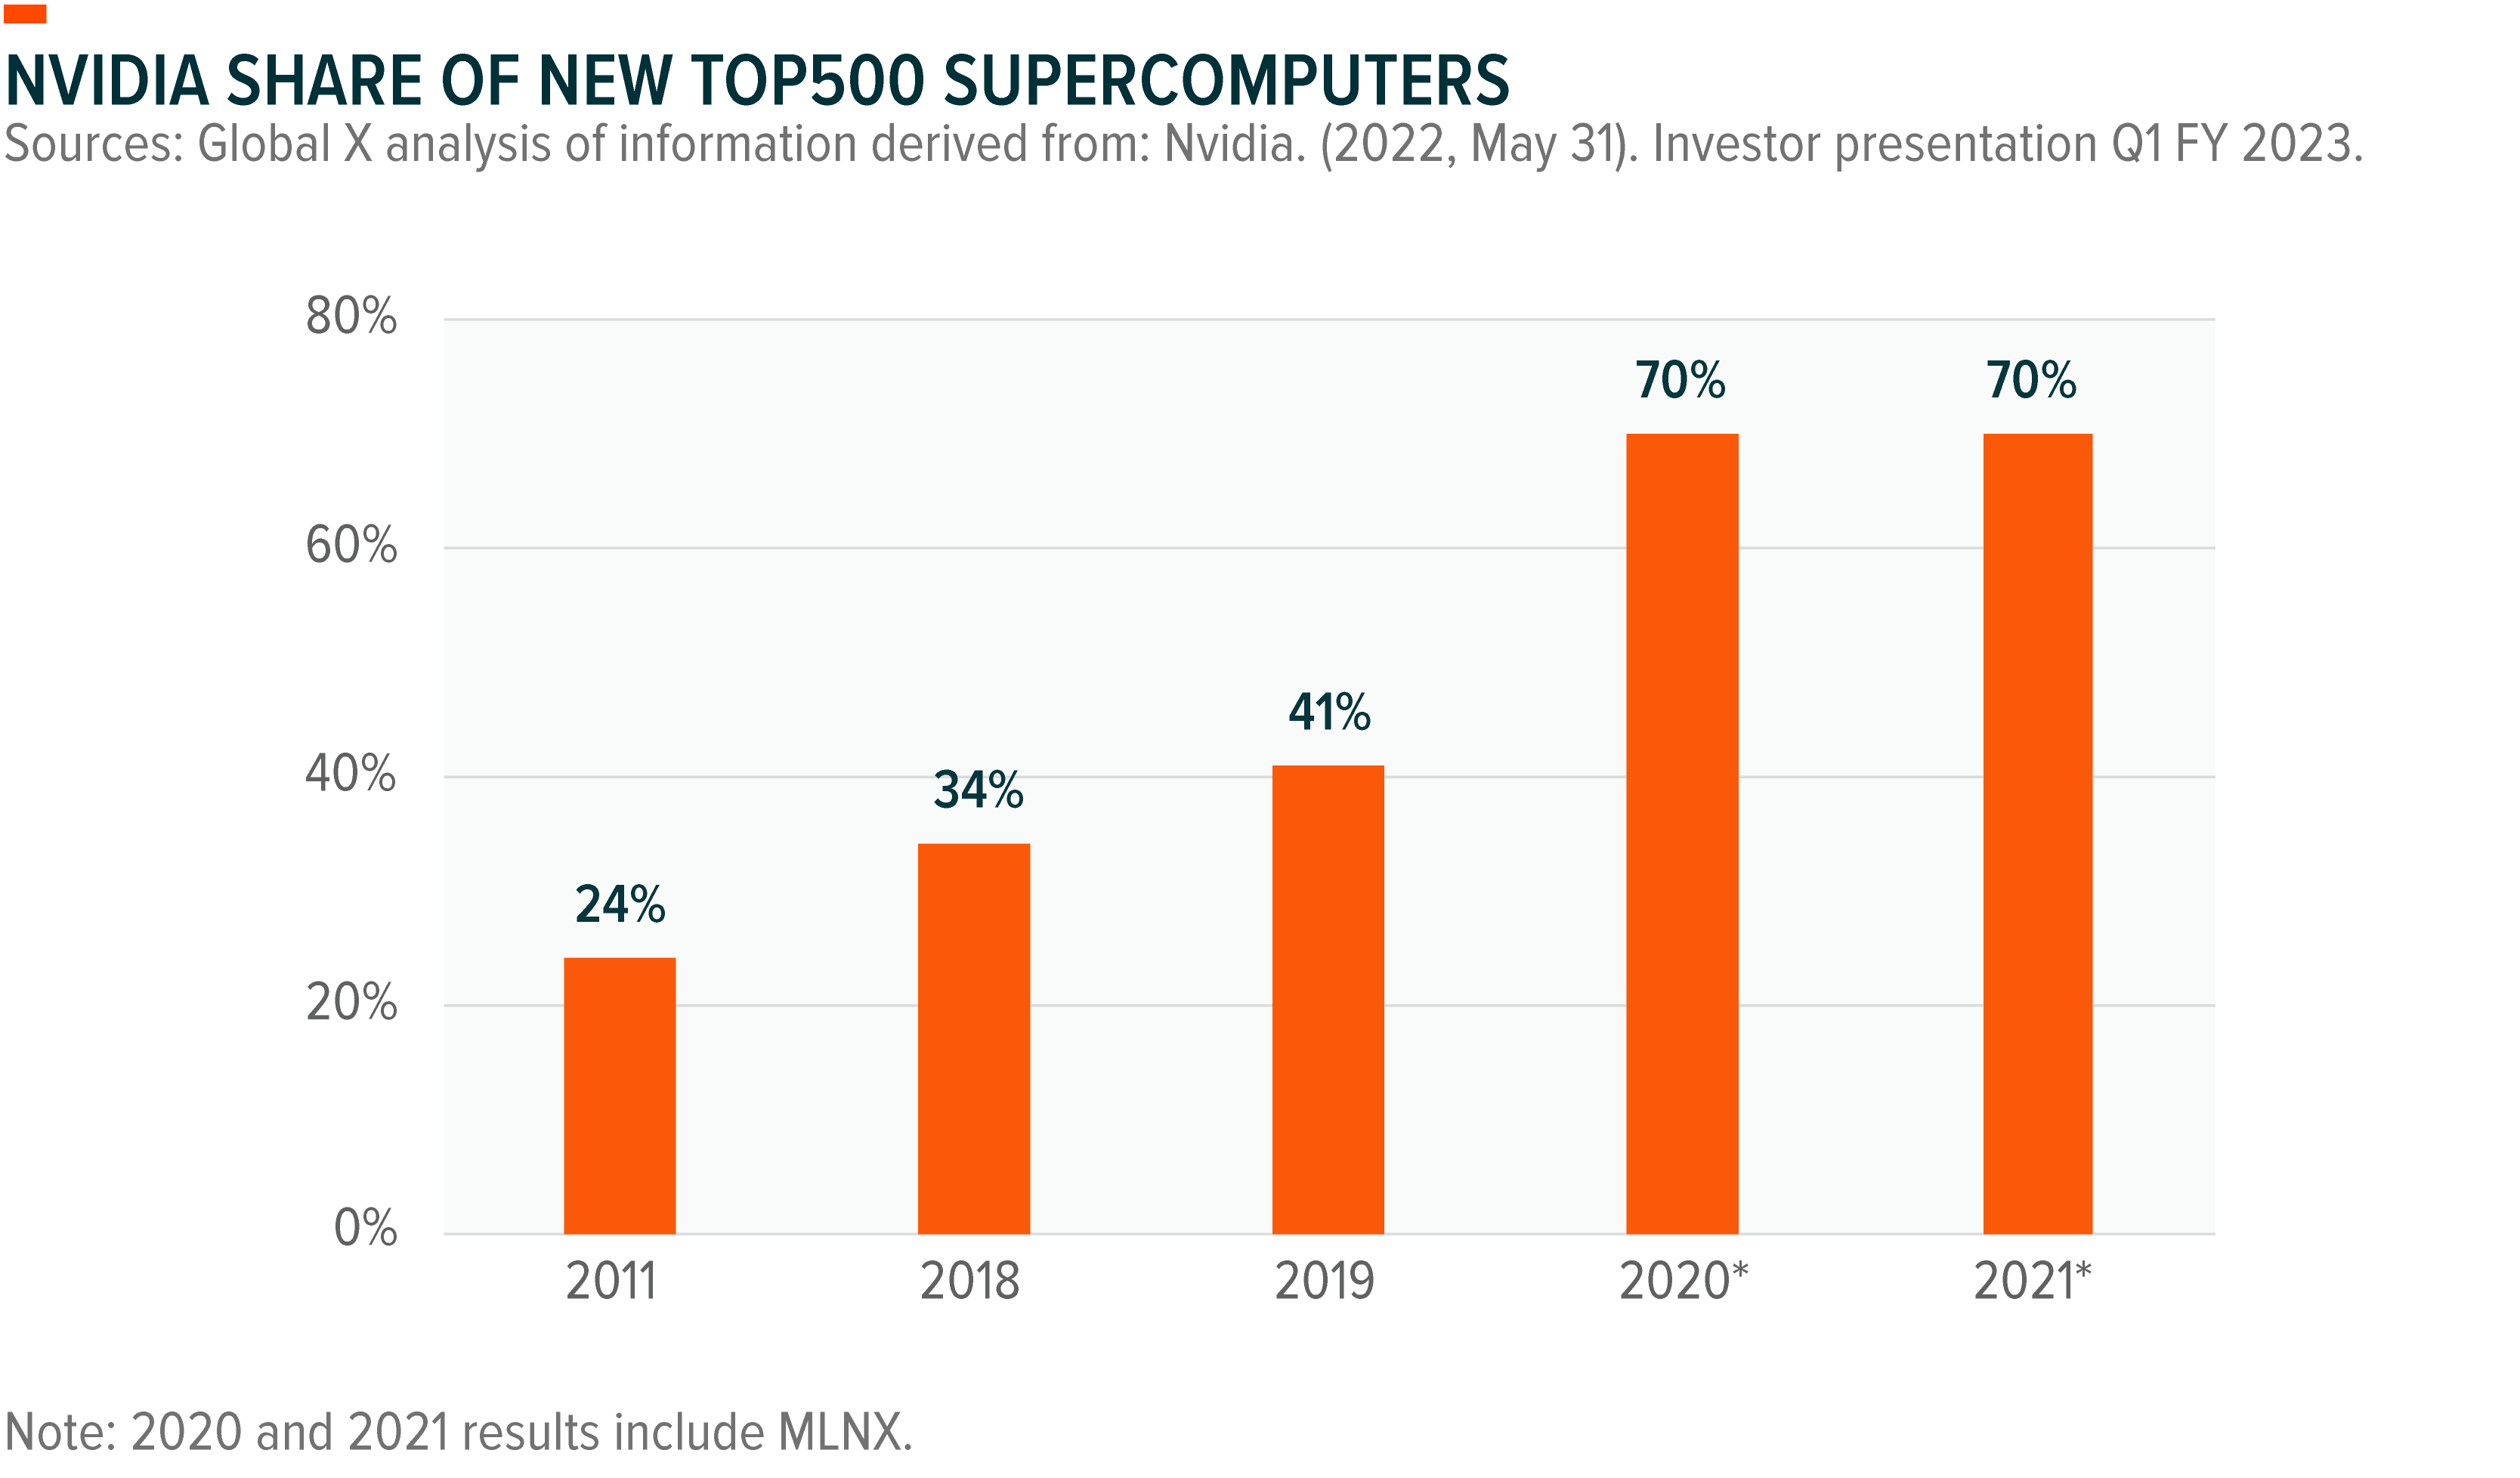
- Nvidia is another example of a company leveraging ML and AI to develop autonomous vehicle (AV) technology. The Nvidia Jetson AGX Systems for robotics leverage "ML, computer vision, navigation, and more to enable robots to learn, adapt, and evolve." The BMW Group is among the early adopters of Nvidias' AI-powered autonomous vehicle system. Nvidia also provides data-center scale computing and commands a 90% share of accelerators in super computing and a 70% share of the TOP500 supercomputers.
E-commerce Marketplaces
- According to the most recent e-commerce platforms report, about 41% of retailers plan to prioritize the technology budget for their platforms next year.
- Platform vendors are exploring new segments, including social commerce, expanding globally to find new growth opportunities, and moving into new industry segments.
- B2B vendors focusing on business-to-business e-commerce clients are now expanding into the business-to-consumer (B2C) segment, whereas B2C platforms are adding new features that resonate with B2B vendors.
- Among the key technologies B2B merchants plan to implement are "web personalization 64%, social media marketing 63%, online payments options 62%, inventory management software 62%, barcode scanning technology 61%, delivery tracking 59%, buy Online, pick up in store 58%, order management software 57%, returns management software 56%, and business intelligence and performance reporting 55%.
- E-commerce marketplace providers plan to roll out new technologies like headless commerce whereby the e-commerce engine is independent of the shopper-facing front and back-end interfaces. This engine allows vendors to add more capabilities and access markets globally.
- Platform providers seek to deliver more robust offerings. An estimated 18% of 93 retailers surveyed by Digital Commerce 360 plan to switch e-commerce platforms. About 29% claimed they anticipate spending from $100,000 to $500,000 to transition to a new e-commerce platform.
- Recently, Google debuted its AI-powered shopping capabilities to compete with Amazon. The AI- and machine learning-powered tools provide consumers with more personalized and visually-engaging results, displays, product information, and suggestions. These features will elevate the customer experience by offering them a more visual and experiential means to shop.
- Amazon.com Inc. also recently launched a new, free-of-charge email plan to help its marketplace sellers to leverage email marketing. Vendors can leverage Amazon's Customer Engagement solution to send marketing emails to loyal customers, repeat customers, recent customers, and high-spend customers. In the past, sellers used the tool to chat with customers who followed brands on Amazon.

Mattresses and Beds
- The mattress space is fragmented, and competing businesses in the segment are deploying organic and inorganic tactics. In addition, the market is also witnessing innovations aimed at improving the overall wellness of individuals.
- The sleep technology market is expanding rapidly and has attracted new entrants, from start-ups to big tech companies. These developments have attracted insurance, healthcare players, employers, and policymakers.
- The market's efforts are currently concentrated in smart beds and mattresses connected to IoT. Adjustable smart beds are on the rise to provide consumers with personalized experiences.
- For instance, there are new technologies, such as putting sensors under the mattress to tell how much a person turns while sleeping and the amount of time spent in bed. The technology leverages the collected data to create customized and personalized training and dietary plans.
- Sleep science has gained traction, characterized by many beds and mattress companies with innovative offerings. The number of sleep device patents jumped by 12% per year for the past decade. The number of existing products in the market has also increased.
- Brands such as WHOOP are enabling consumers to track their sleep using wearables. The data collected can be used to improve sleep quality through innovative sleep supplements and smart mattresses/beds.
- Players like Eight Sleep provide mattresses and mattress covers with AI tools that monitor and improve sleep via temperature control, daily alarms, and data analysis for use in optional private sleep coaching.
- Notable players like ResMed offer devices and digital health technologies to manage sleep apnea. Users can access personal sleep data, use cognitive behavioral therapy (CBT) applications to treat the condition, and monitor the outcome. From a business perspective, unifying sleep disorder diagnosis, treatment, and tracking significantly impacts growth and profitability. In addition, the data is valuable to insurance players and payers alike.

4. Smartphone Adoption Statistics in the U.S.
Smartphone Adoption Rates
- In 2019, the U.S. smartphone adoption rate as per data shared by GSMA was 85% and is anticipated to reach 95% in 2025.
- In 2021, the adoption rate throughout North America declined to 82% and is expected to reach 85% by 2025.
- Another report claims that as of 2022, an estimated 85% of U.S. adults owned a smartphone.
- 85% of men and women in the U.S. currently own a smartphone.
U.S. Smartphone Adoption Demographics
- The U.S. smartphone adoption rates remain highest among the younger population and lowest among the elderly.
- The ownership based on age in 2022 is as follows 96% among those aged 18-29; 95% among those aged 30-49 years; 83% adoption among those aged 50-64 years, and 61% adoption among those aged above 65.
- Before the pandemic, smartphone ownership in the U.S. remained relatively high with 96% of those aged 18-29 owning a smartphone, followed by 92% of those aged 30-49 years, 79% among those aged 50-64 years, and 53% for those above 65 years.
- Presently, 89% of smartphone adopters in the U.S. are urban dwellers, 84% are suburban dwellers, and 80% come from rural America.
Smartphones Digital Media Time
- In the U.S., smartphones account for over 70% of the country's digital media time.
- The most common digital media consumed on smartphones include games, accounting for 94% of digital time, 92% social media, and 83% entertainment.
- Education (77%) and government (72%) remain the only forms of media users will rely on desktops and not smartphones.
- In 2019, smartphones accounted for 70% of the nations digital media time, with mobile devices accounting for 77%.
- The most popular categories included games, social media, and entertainment. The percentage share remains the same, implying that there has not been major changes in smartphone digital media time from 2019 through 2022.
Smartphone Adoption Based on Income
- In the U.S., smartphone adoption varies with levels of income.
- Thus, the rich are highly likely to own a smartphone compared to those with lower income levels.
- In 2019, an estimated 29% of Americans earning less than $30,000 per year did not own a smartphone. Fast-forward to 2022, the percentage drops to about 24% of Americans.
- Still, in 2019, about 44% of lower-income Americans did not have home broadband services, versus 43% in 2022.
- Likewise, 46% did not have a traditional computer, versus 41% in 2021 who did not have a desktop or laptop.
Smartphone Dependence
- Smartphone dependence in the U.S. for online access is high among younger generations, individuals with a high school education or less, and lower-income Americans.
- In 2019, an estimated 22% of Americans aged 18-29 showed the highest reliance on smartphones, but the figure increased to 28% in 2022.
- Hispanics were the most reliant on smartphones in 2019 at 25%, Blacks followed at 23%, and Whites at 12%. In 2021, the figures changed as follows, Hispanics 25%, Blacks 17%, and Whites 12%.
- In 2019, the dependency rate among rural Americans was highest at 20% but declined to 17% in 2021.
- Likewise, dependence among urban dwellers plateaued at 17% from 2019 through 2021, while for suburban dwellers, it declined from 13% in 2019 to 12% in 2021.
Research Strategy
For this research, we leveraged the most recent and trusted pieces of information published by leading market research and consulting companies like Business Insider, Biz Journals, Deloitte, Digital Commerce 360, EY.com, Fintech Magazine, Forbes, GSMA, Marketing Charts, McKinsey, Pew Research, PR Newswire, PR Web, PWC, Statista, TechCrunch, and The Drum, among other sources. Data specific to U.S. smartphone adoption rates appear to be changing gradually; however, some reports provide historical data for 2019 as 2022 because it is the most recent and up-to-date data on that particular matter. To consistently compare changes in consumer smartphone adoption, the team has leveraged similar sources updated at different time frames to ensure the accuracy of data and research methodology.